Working Area
When you open the working area you see a dashboard listing the work centers connected to his work area.

In the example, the operator’s device is located in the Robot work area for which 2 work centers / resources (machines) are operational.
In the control panel it is also visible that one machine is active, the other is stopped.
Production Panel
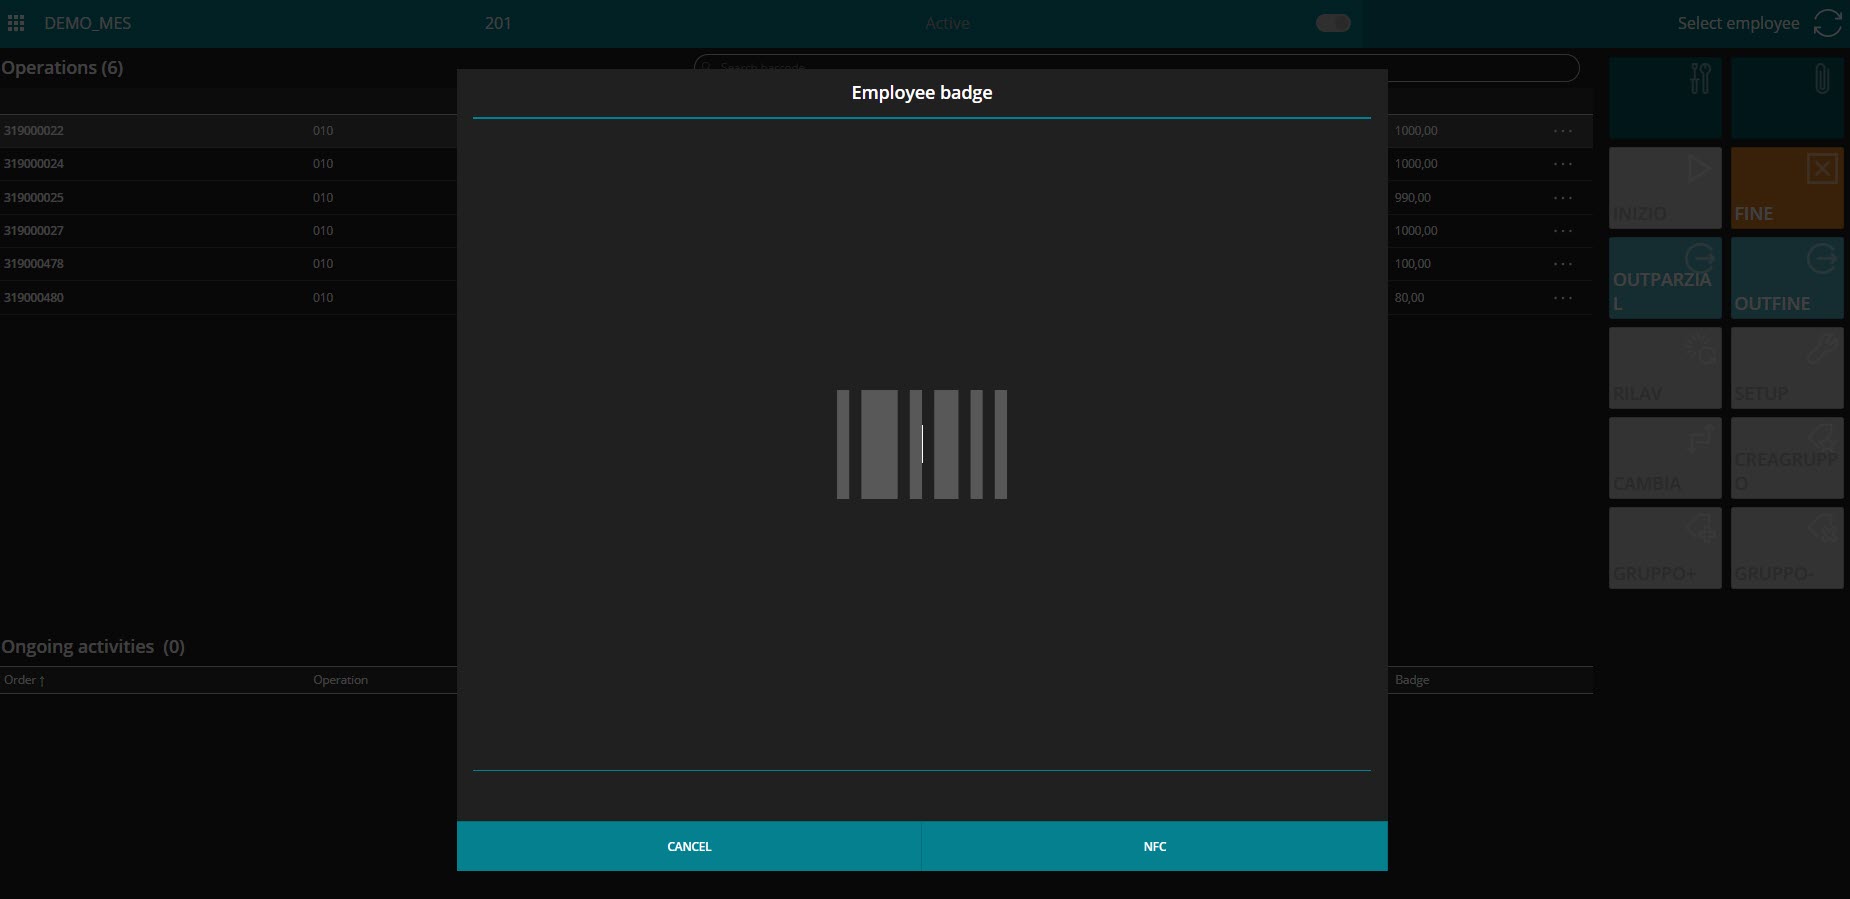
rom the menu, after logging in via barcode, the user can access the Production Panel where you can see the operations to be performed (or have already been performed) and the possible reasons (e.g. start or end of processing). From setup it is possible to decide what to display and what not to display within the page.
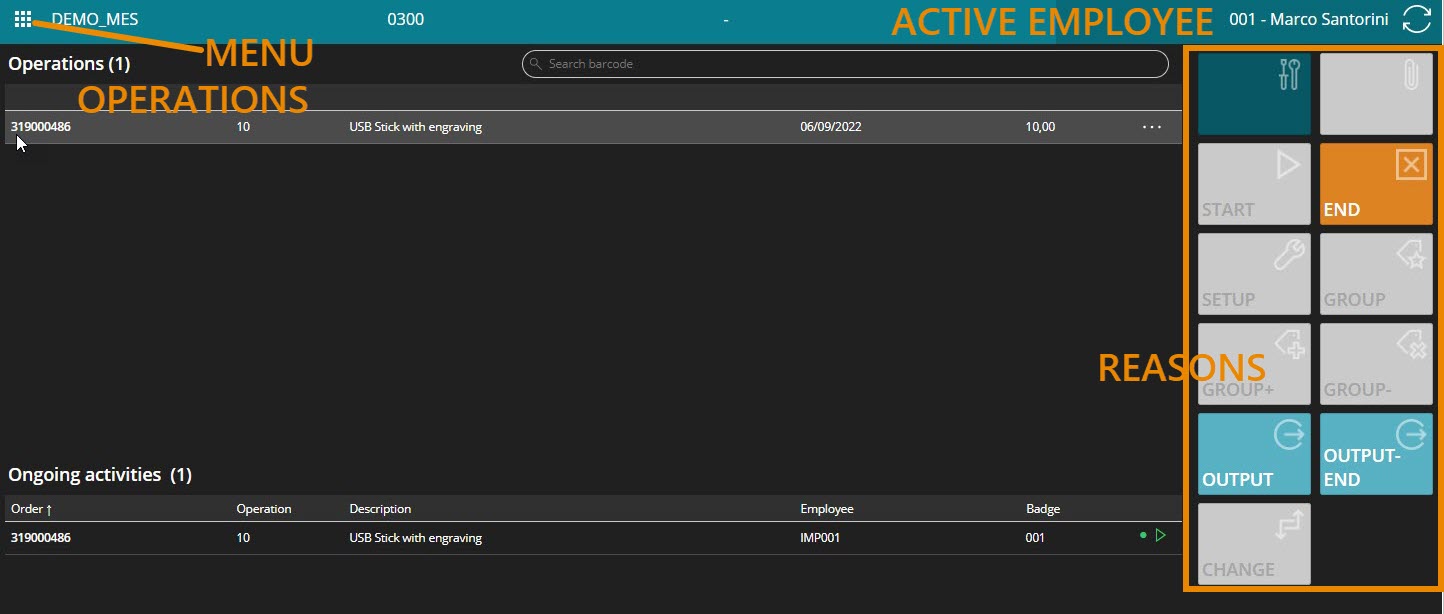
The available operations are listed by date entered, but it is possible to change the sorting.
| Note |
|---|
| Multiple users can log in to the same machine. |
Menu
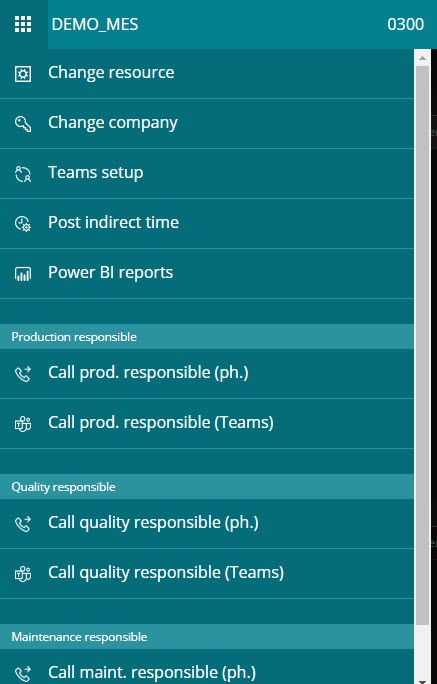
The menu at the top left allows access to the various pages: it is possible to open the page in which to change the resource (machine) on which one is working. If the user is enabled (from setup) he can create work teams. You can log indirect hours or get PowerBI reports on machine performance.
| Action | Description |
|---|---|
| Change resource | Allows you to return to the Work Area where it is possible to change the Work Center |
| Teams setup | If enabled, you can manage / create work teams (a flag defines if the user is a team leader) 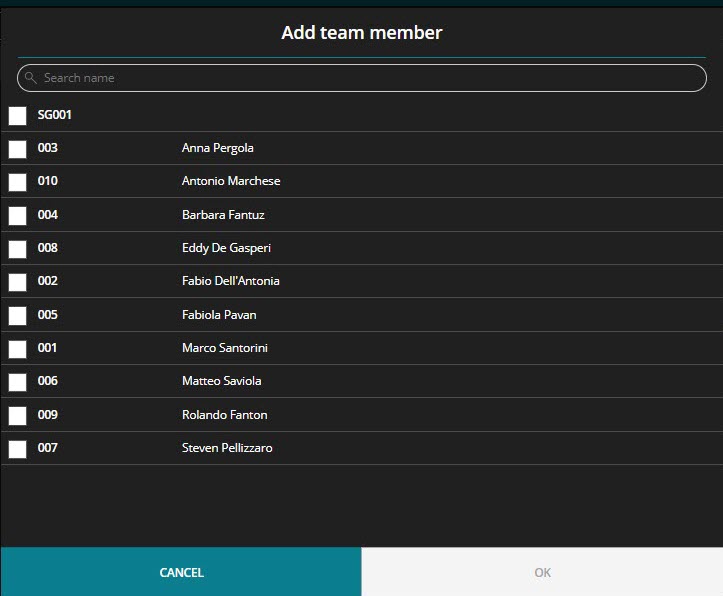 |
| Post indirect time | Indirect hours can be recorded 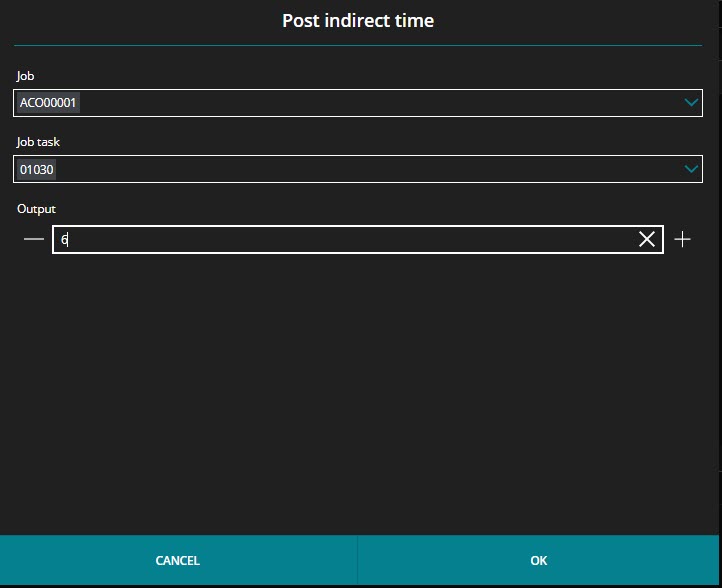 |
| Power BI reports | A dashboard displays POWER BI reports showing the performance of a specific machine |
| Call prod. responsible (ph.) / Call prod. responsible (Teams) | The production manager can be reached by phone or via Teams, for example in the event of problems on the machine |
| Call quality responsible (ph.) / Call quality responsible (Teams) | The quality manager can be reached by phone or via Teams, for example in the event of a recurring problem on the quality of some pieces |
| Call maint. responsible (ph.) / Call maint. responsible (Teams) | The maintenance manager can be reached by phone or via Teams, for example in the event of a machine breakdown |
Production Panel functionality
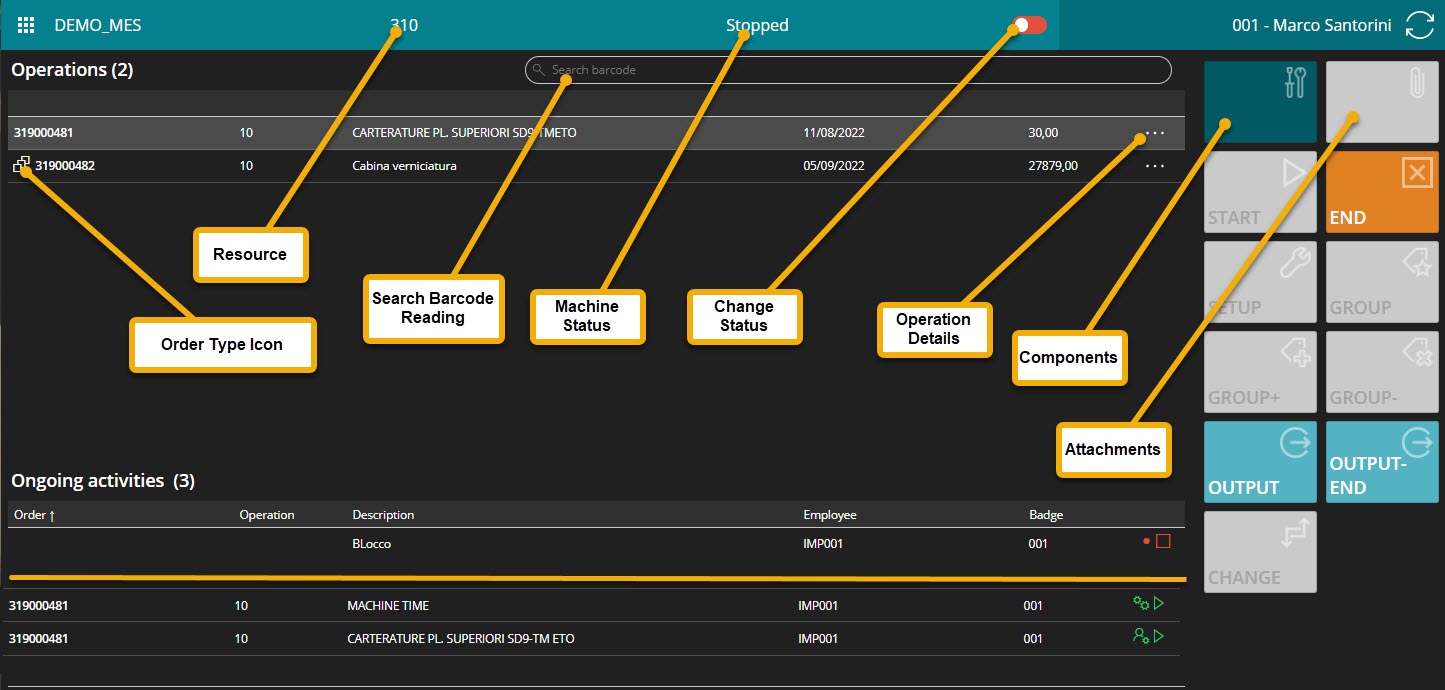
The three dots at the end of the line give access to the detail page with the specifications.

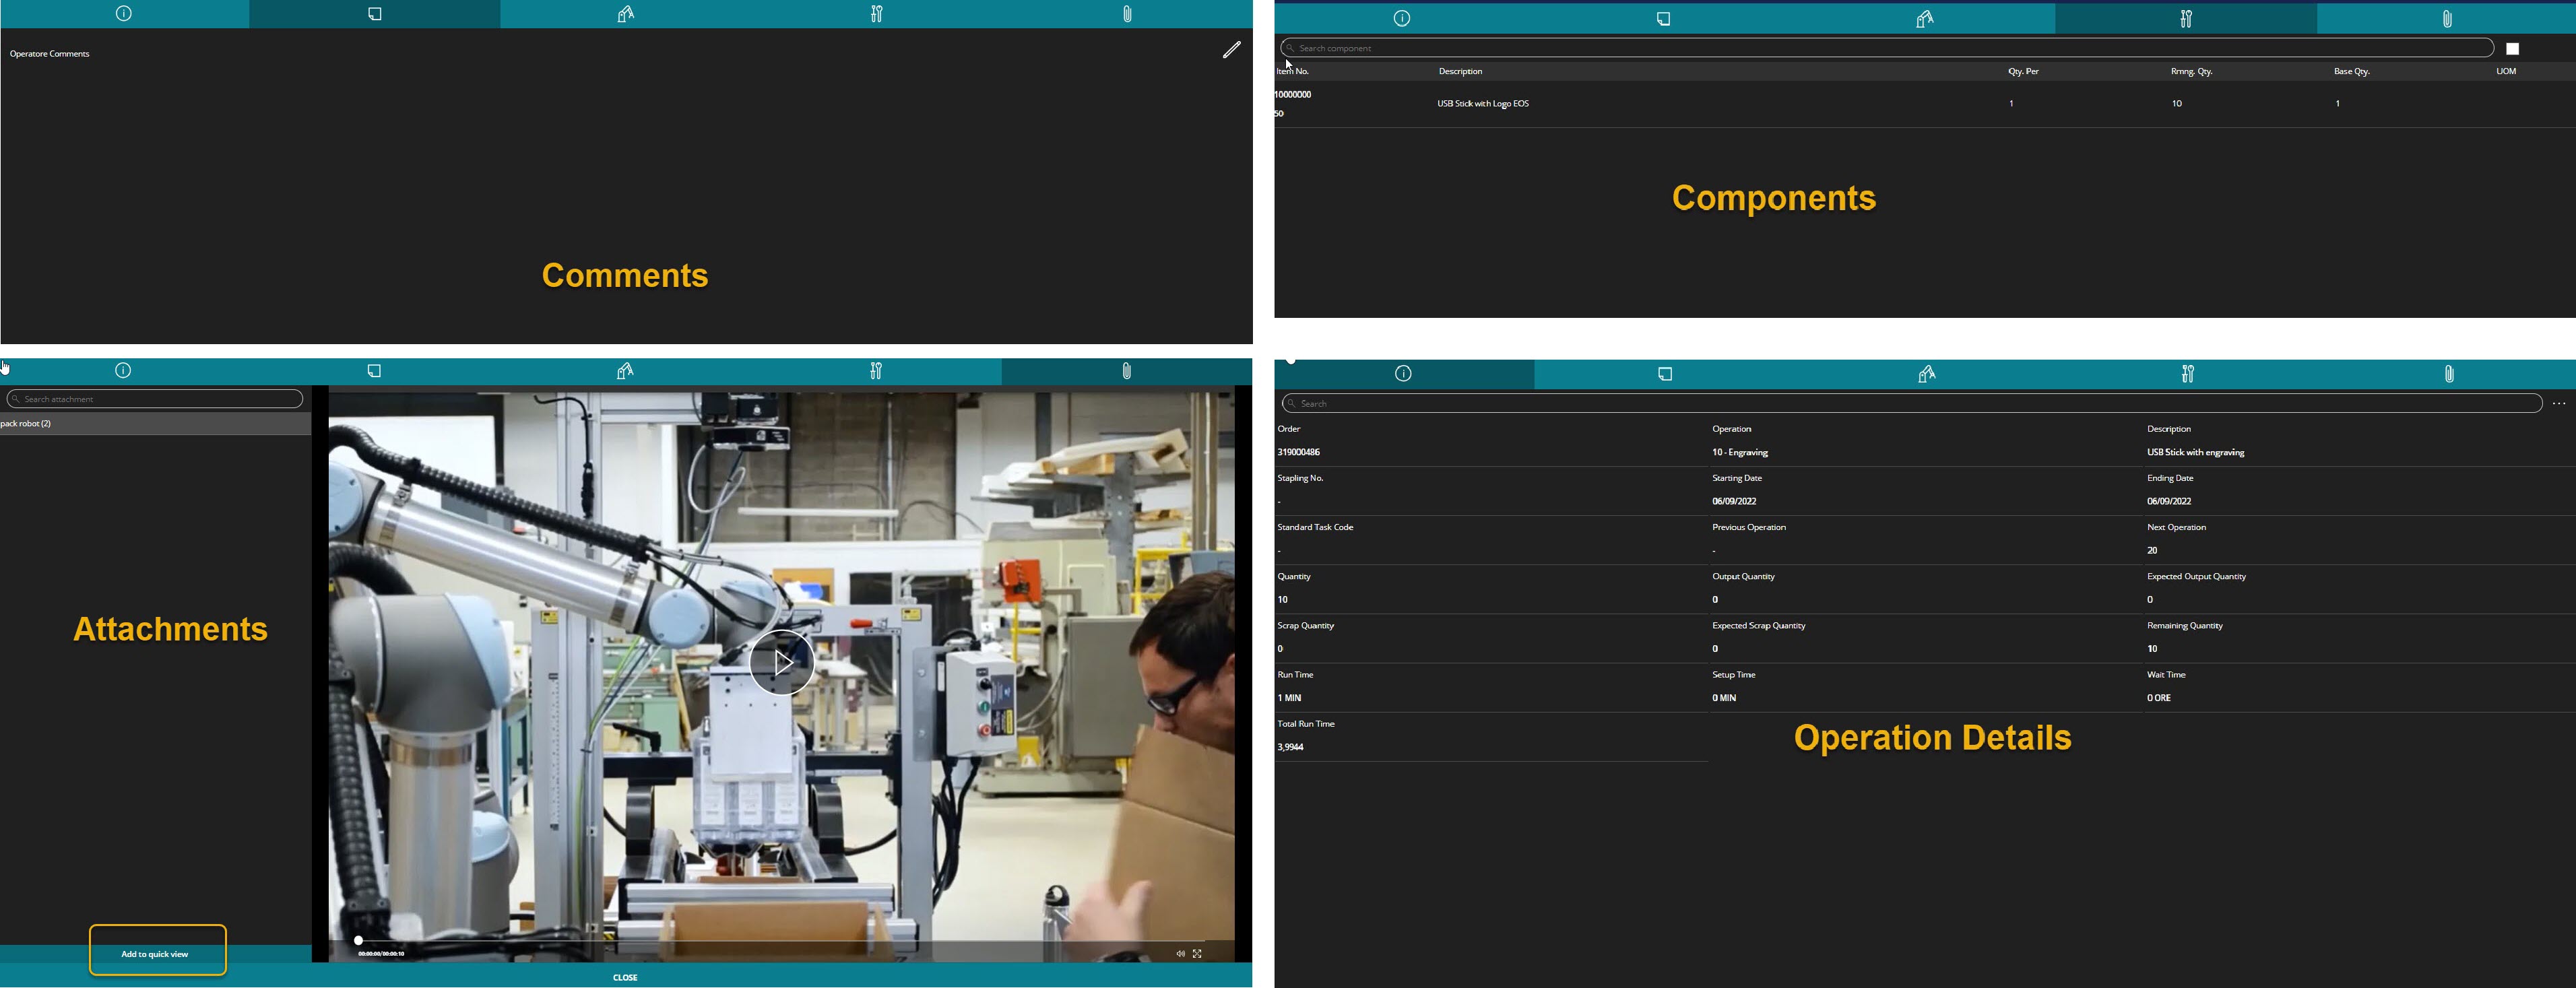
You can view the page containing any attachments (documents, videos) , the components .
At the top there is a bar in which to search / read the barcode.
Reasons
The reasons are visible on the right of the Production Panel. For example, the operator clicks on Setup to start a tooling phase or on Start to start a production phase or on End to end it. Below, in Activity in progress, the reasons can be identified by symbols:

Output
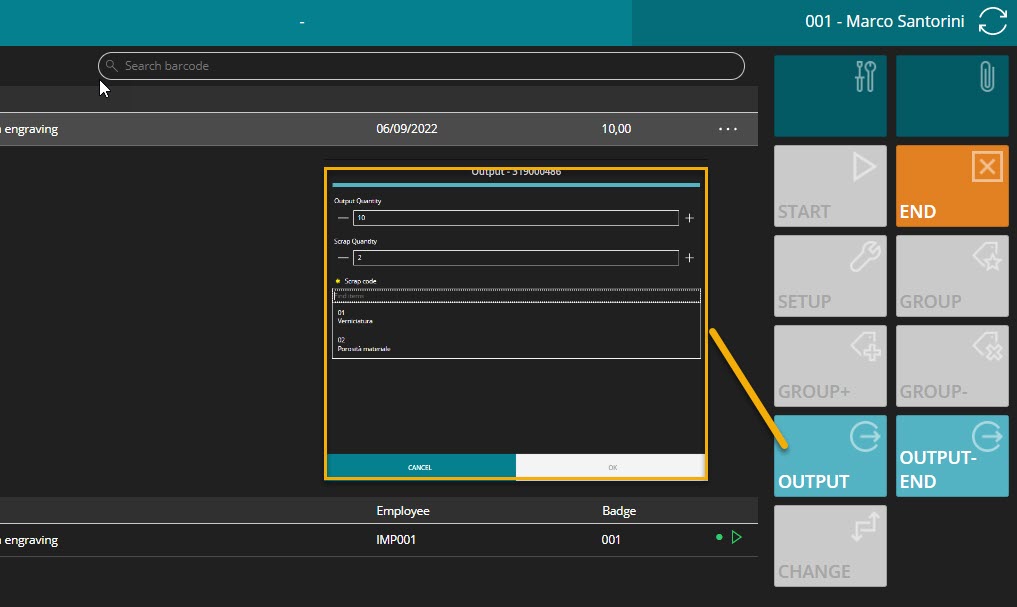
In the event of a Rejection, a Reason must be entered.
Groups
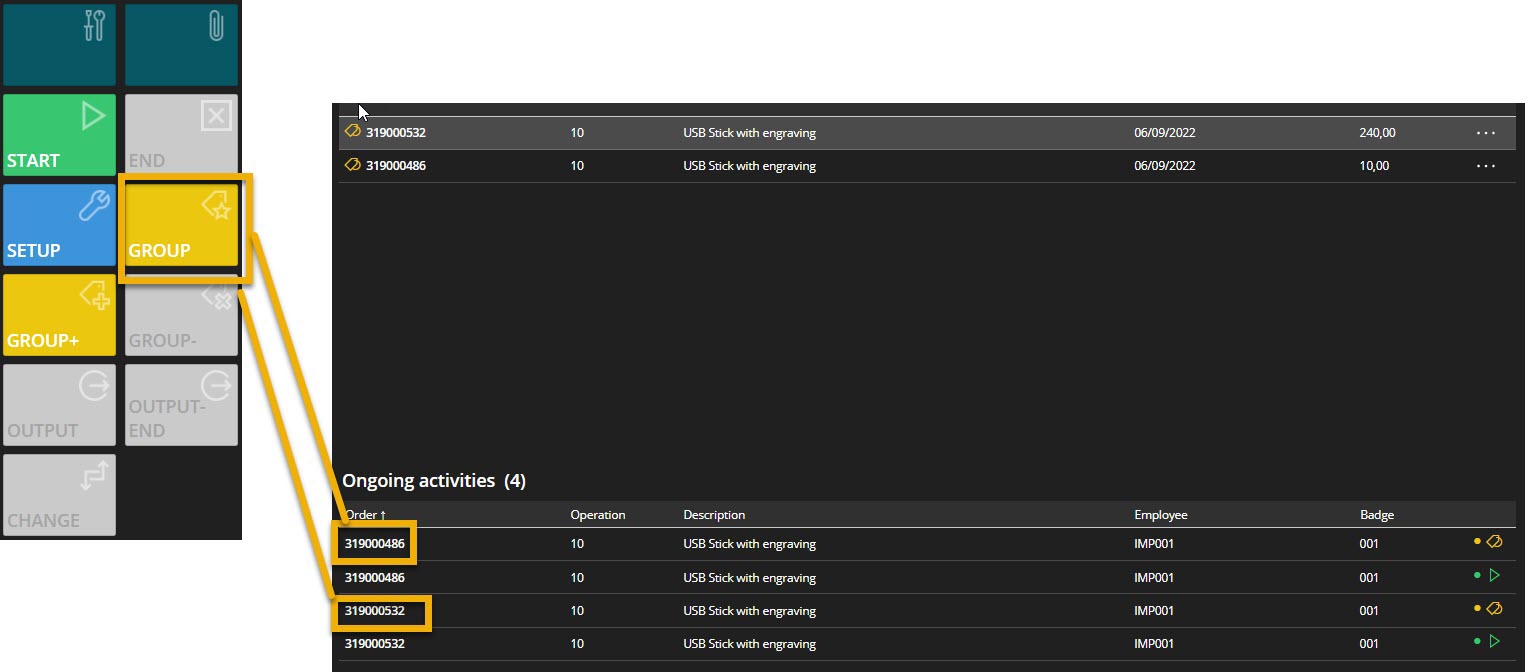
The operations can be grouped by Create Group and later they will be worked together:
Quality
You can create quality control orders and the required parameters (attributes, measures, etc.) are recorded for them. The expected / measured values can then be managed.
Tracking - Lot Number
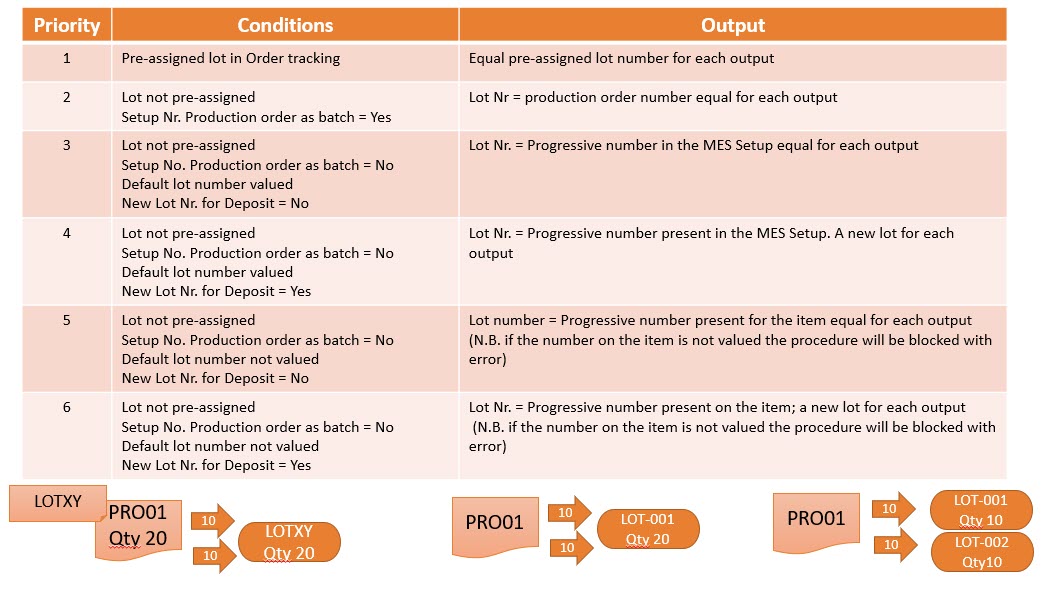
Tracking is managed in different ways, both by pre-assigning a lot number and by not pre-assigning the lot:
Tracking - Serial Number
Also in this case the numbers can be pre-assigned or not:

Work Center: employee entries
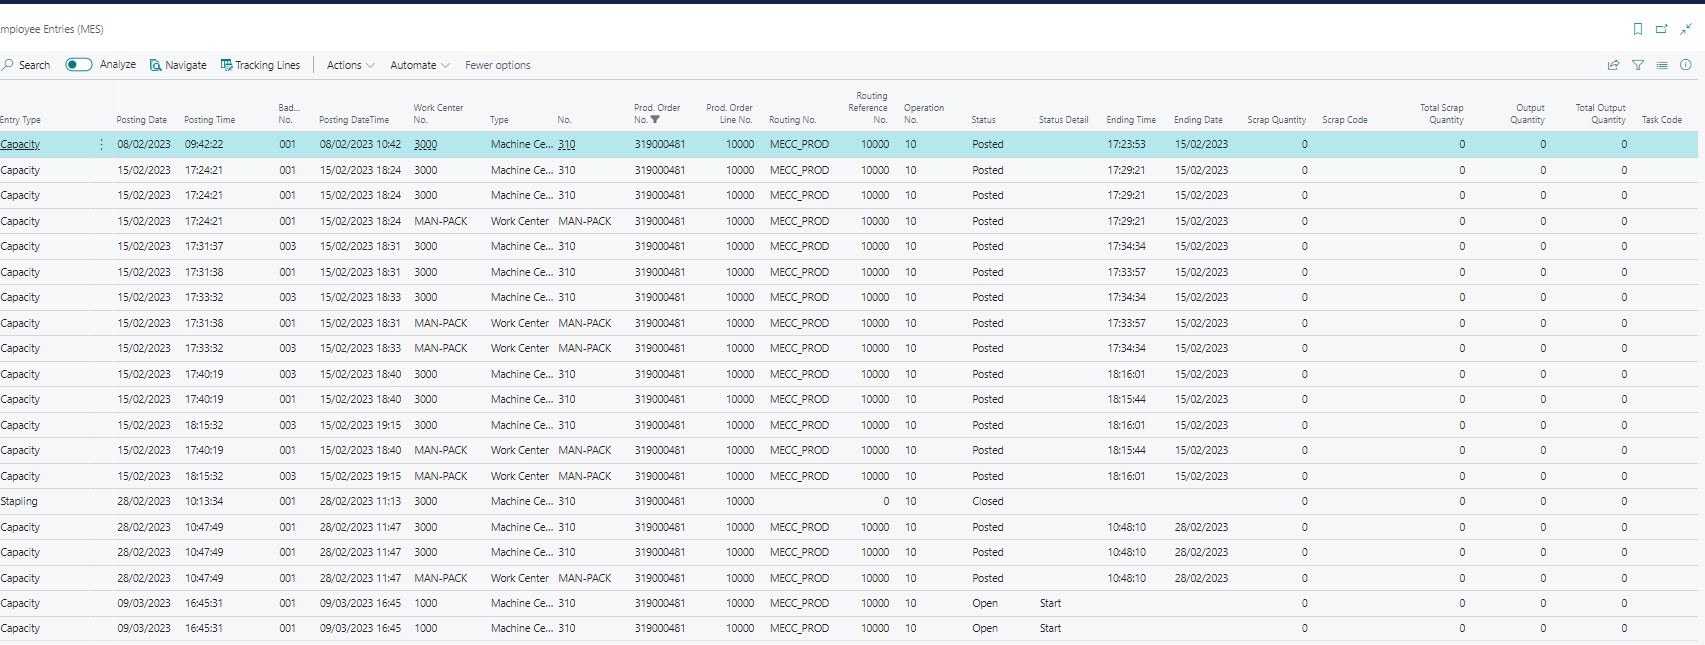
Several operators can work on one machine. There is therefore the need to manage machine times, but also man times.
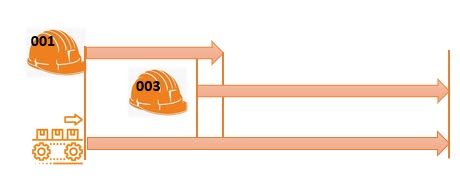
Man and machine times are different. Example: operator 001 works from morning until lunch. Operator 003 starts the shift just before lunch. The machine, on the other hand, works from morning until evening.
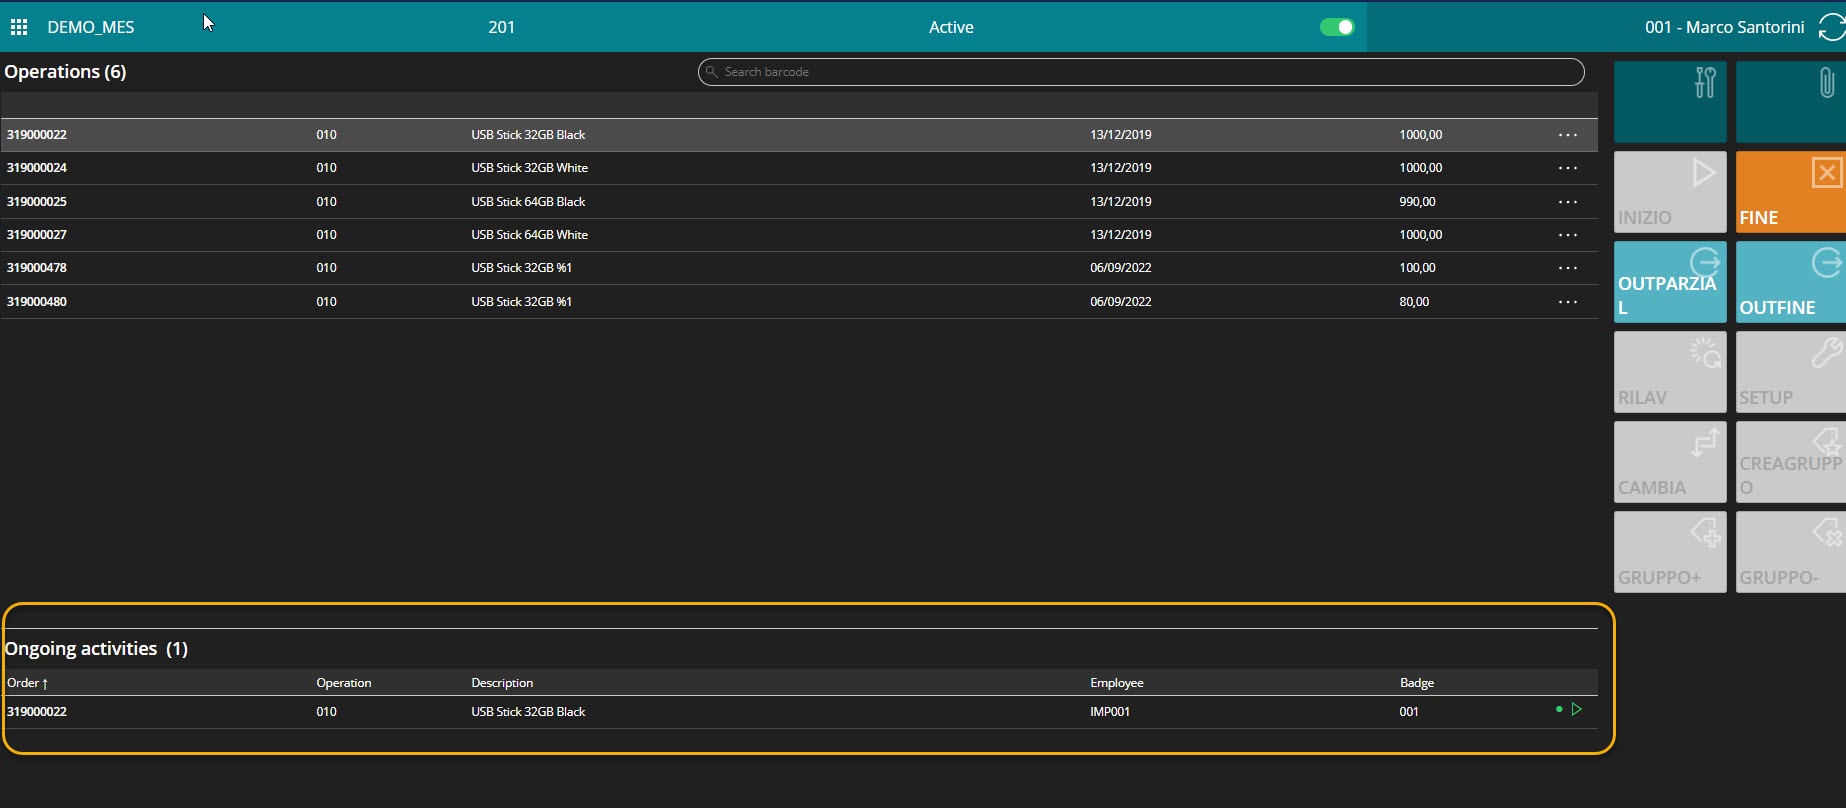
The Power MES details man and machine work movements:
Feedback
Was this page helpful?
Glad to hear it! Please tell us how we can improve.
Sorry to hear that. Please tell us how we can improve.